Reports on the store PC answers the questions a shop owner asks every week: what did we sell today, did we make money this month, what is the stock worth, who owes us, which brands sell, what is running low before the month-start rush, and what has been sitting on the shelf too long. Every figure comes from the same postings as the day book, so the reports and the books always agree.
Open Reports (under Money). The tabs are Daily, Day by day, Best sellers, By tender, Profit and loss, Purchases by supplier, Stock value, Ageing, Brands, Low stock & reorder, Slow-moving, Stock in & out, Purchases by item, By cashier, Discounts & price changes, Near expiry and Missed sales. For the period reports, choose This month, Last month or Financial year (from 1 July).
Every tab can leave MartPOS: Excel saves a workbook (.xlsx) with numbers and dates Excel can add up and sort, CSV saves it for Excel too (Urdu names open correctly), PDF saves an A4 copy and opens it, and Print prints it on A4.
Daily
The day's sales for the whole branch, all counters together. Move between days with the arrows beside the date.
- Net sales, Gross profit, Returns and Discounts given at the top.
- Profit and loss for the day: gross sales, discounts, returns, cost of goods sold (at the weighted average cost of each item sold) and gross profit.
- Bills by how they were paid: cash, card, bank transfer, EasyPaisa, JazzCash, on account and from advance. "Less refunds. On account is still owed and from advance was paid earlier: neither is new money. Card and wallet entries are recorded, not verified with the provider."
- Advances held for customers: each customer with their phone and what was Received, Used, Refunded and is still Held.
Save as PDF saves the day's report as the store server lays it out; Excel, CSV, PDF and Print at the top work too.
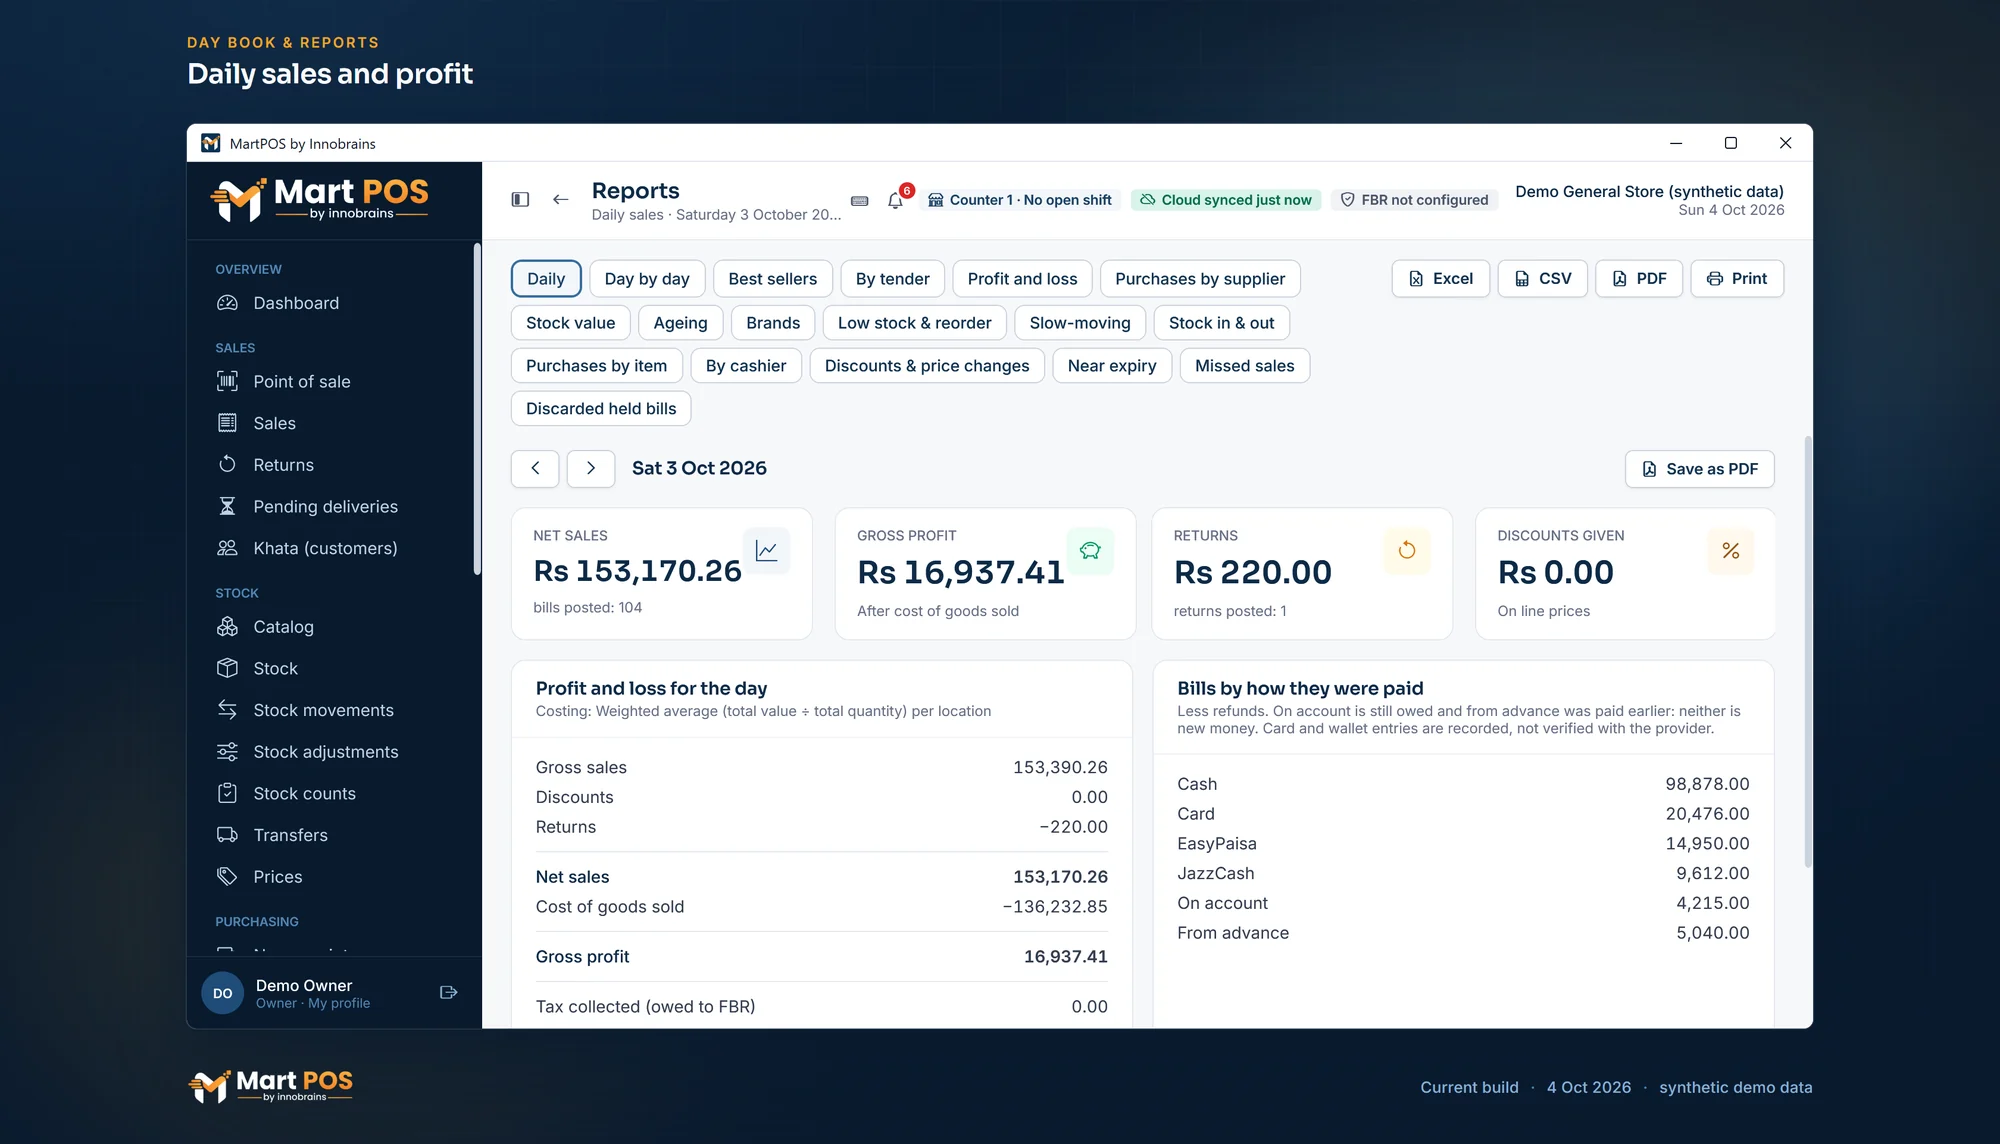
Daily sales and profit. Net sales, gross profit, returns and discounts for the day, the day's profit and loss, and bills by how they were paid. Screenshot of the current build (4 Oct 2026), synthetic demo data.
Day by day
Every day of the period, days without bills at zero: a bar chart of net sales per day (hover over a bar for the day's figures), then a table with each day's Bills, Returns, Sales, Returned, Net, Tax (FBR) and Gross profit. The cards show the period's net sales, gross profit and bills. It covers at most a year at a time. Use it to spot the busy days, such as the first days of the month when salaries are paid.
Best sellers
The top 100 items of the period by quantity sold, less what customers returned in the period: each item with its SKU and brand, the quantity Sold, the number of Bills it was on, Net sales, Cost and Gross profit. Quantities are in base units, so a carton of 24 sold counts as 24 and a loose item counts in kg or litres. Because the ranking is by quantity, a cheap item sold by the piece can sit above sugar sold by the kilo; look at Net sales and Gross profit too.
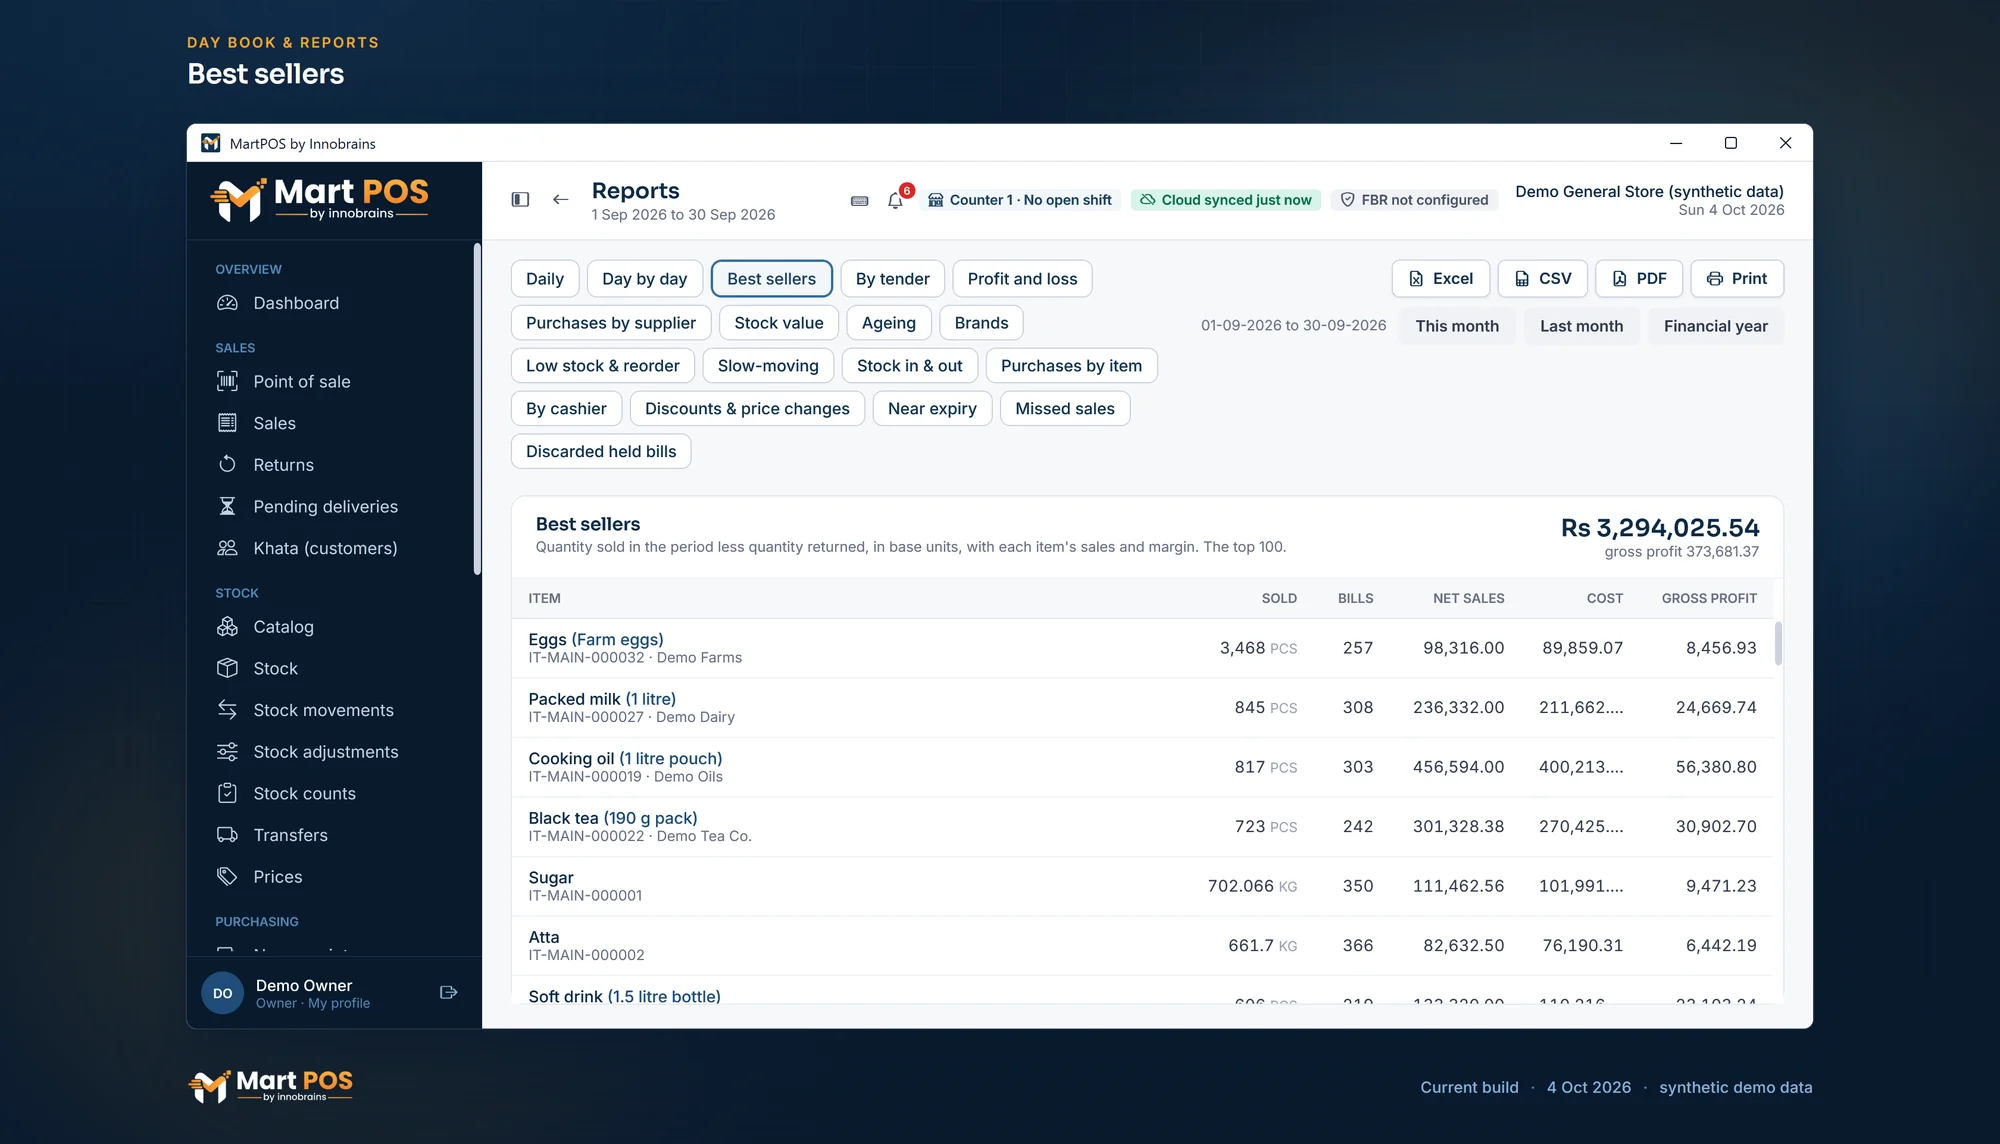
Best sellers. The items that sold most in a period, each in its own unit (kg or pieces), with net sales, cost and gross profit. Screenshot of the current build (4 Oct 2026), synthetic demo data.
By tender
What the period's bills were paid with, per tender: bills, Received, Refunded on returns, and Net. On account is still owed and from advance was paid earlier: neither is new money. It helps match card and wallet settlements for a month.
Purchases by supplier
Per supplier for the period: bills entered, Gross, Discount, Net, what was Paid with bills when they were entered, goods Sent back (at the price claimed) and what the shop Owes now (today, for every period). See Supplier payments and advances.
Profit and loss
For any period: Sales, then Expenses and losses by account (cost of goods sold, stock adjustments, cash over or short, rent, wages and the rest), and Net profit. Cash rounding of bills is its own line, Rounding: a minus figure when bills were rounded up more than down. "From the day book for the dates shown. Advances, sales tax and money moved between accounts are not income." Tax charged on bills and FBR's Re 1 POS Service Fee are both booked to Sales tax payable, so neither counts as sales or profit.
Stock value
What the stock is worth now, at cost:
- Sellable stock at cost, Damaged, at cost and the Total, equals the inventory account.
- By category: items, quantity and value per category (items without one are under No category).
- Items holding the most value: where your money is sitting.
Ageing
"Who owes what, and for how long." Switch between Customers and Suppliers. For each, what is owed in 0–30, 31–60, 61–90 and Over 90 days, and the Total. "Payments settle the oldest amounts first. Days count from the bill date." Use it to decide whose khata to follow up, and which distributor to pay first.
Brands
Brand performance for the period, by the brand set on each item (items without one are under No brand): the quantity Received, the quantity Sold (less returned), Sell-through (sold out of what was received in the period), Net sales, Gross profit, what was Sent back to suppliers, and what is On hand. It shows, for example, whether one tea or cooking oil brand earns more than another, and helps decide how much of each to order next month.
Low stock & reorder
Active items at or below their reorder level (set in the item form, in the base unit), and items with nothing on hand that sold in the last 30 days. Stock is sellable stock at every place, shop floor and godown together. For each item: On hand, Reorder at, Sold 30 days, the Suggested order, and who it was Last bought from, when, and at what Last cost per base unit. The suggestion brings stock back to twice the reorder level, or covers the last 30 days' sales if that is more; the cards show how many items are low, how many sold out while still selling, and what the suggested order would cost. Choose an item to open its own page. See Adding items for reorder levels.
Slow-moving
The shop's own stock of items not sold for 30, 60, 90, 180 days or a year or more, most value first: On hand, Value at cost, Last sold, Days since, and Last received. An item never sold counts from when it first arrived, so yesterday's delivery is not dead stock. Use it to choose what to return to the supplier while their return window is open, to put on a clearance offer, or to move to the front shelf. For items that track expiry dates, Near expiry shows which slow packs are close to their date; check the dates of other items yourself.
Stock in & out
For each item over the period, from the stock ledger in base units: Opening, In (purchases, returns from customers, found stock, goods from other branches), Out (sales, returns to suppliers, losses, goods sent to other branches), Of which sold (sold less returned by customers), and Closing. Opening + in − out = closing for every item. Moving stock between the shop floor and the godown, and marking stock damaged, change nothing here.
Purchases by item
Per item for the period: the number of Bills, Paid qty and Free qty in base units, the Cost, and the Cost / unit with free pieces spread in, as stock is valued, with the supplier it last came from. It shows what a distributor's bonus (one carton free with ten, say) really brings the cost down to. Choose an item to open its page.
By cashier
Per cashier (who made the bill), or per counter with Counters: Bills, Sales after discounts and before tax, Discounts, the Returns they took and their value, Net and Average bill. Returns count for whoever took them, or at the counter where they were taken.
Discounts & price changes
Every bill line sold at other than the item's standard price in the period, newest first: a discount, a price changed at the till, a contract, price-list, quantity or order price, a promotion, or a sale below cost. Each line shows the bill, when, the cashier, the item, the List price that day, the price it was Sold at, where the price came from, the Discount and its reason, and what was Given off the list price (the list price times the quantity less what the line was sold for). Lines sold below cost are marked, with the reason the manager gave. The cards add up discounts, what was given off list prices, and lines sold below cost; the printout also totals them by where the price came from. Choose a line to open its bill.
Near expiry
For items with Track expiry dates ticked: each stock lot (expiry date and batch) whose date falls within 7 days, 30, 60 or 90, or has already passed, with the days left, its batch, how much of it is in stock (and at which places, when more than one), and the document that first brought it in. Sales take the earliest date first, so the lots are what should be on the shelf; if it is not rotated, count the item by lot. Stock in a lot with no date (from before dates were kept, or received without one) is listed under the table. See Expiry dates and the near-expiry report.
Missed sales
What customers asked for and could not buy in the period, noted at the till with Asked for (Ctrl+M): each item, or the words used, with how many Times, the Qty asked for, Why (out of stock, not kept, or the price) and when it was Last asked, most asked first. Use it to raise reorder levels, try a product customers keep asking for, or check a price. See Missed sales: what customers asked for.
The dashboard
The Dashboard (under Overview) is where owners, managers and the back office start the day. Its figures are the daily report's: Sales today is net sales after the day's returns, before tax; Profit today is that less the cost of the items sold; This month runs from the 1st to today. The chart shows net sales and profit for each of the last 30 days, and Paid today splits the day's takings by tender, less refunds, as Bills by how they were paid does. The top five items of the month, by sales after returns, are listed beside a link to Brands.
Needs attention counts what is waiting, and each row opens the screen that deals with it: customer orders whose hold has run out or whose items are held for pickup, goods from another branch to count in (on Transfers), items at or below their reorder level (on Low stock & reorder), stock lots of items that track expiry that are past their date or expire within the near-expiry days (on Near expiry), items added at the till that still need review (on Catalog), shelf labels printed with a price that has changed since (in the Labels window), returns to suppliers not credited yet, changes from MartPOS Cloud needing a decision or records the cloud refused, bills not with FBR yet, a backup that is missing, old, failed or not encrypted, a licence that needs attention or the days left in a trial, an update that did not install or is due, and tills running an older MartPOS than the store PC. Money shows the balances of cash, bank and wallets from the books, what customers owe on khata and what you owe suppliers; the last two open Ageing.
Each part shows only to those allowed to see it: the sales, profit and money need the reports and accounting permissions, Getting started is for whoever sets the store up, and Recent activity for those who may read the audit log. A cashier does not have the dashboard.
The audit log
Audit log (under Administration) lists every change MartPOS records, newest first: items and prices added or edited, price lists and promotions, staff and counters, receipt and business settings, FBR settings and invoices sent or resolved, receipts printed again, shifts opened and closed, books closed or reopened, imports, changes from MartPOS Cloud, and more. Filter by what was done, the kind of record, who did it, and when (Any time, Today, This week, This month or Custom). Choose an entry to see who did it and when, the reason when one was given, and What changed: each field with its value before, struck through, and after. Nothing in the log can be changed or deleted. Only owners and auditors can open it.
Who can see reports
Daily, Day by day, Best sellers, By tender, Profit and loss, Purchases by supplier, Ageing, Brands, By cashier and Discounts & price changes need the reports permission: owners, managers, accountants and auditors. Purchases by item and Missed sales need the reports or the purchasing permission, so warehouse staff can open them. Stock value and Slow-moving are about what stock cost, so they need the permission to see costs, which every role but cashiers has. Low stock & reorder, Stock in & out and Near expiry are open to everyone who can see stock, cashiers included; a cashier sees quantities there, never costs.
Reports in MartPOS Cloud
The owner portal shows each branch's daily sales with when the branch last reported, and read-only Reports (sales by branch and by day with gross profit, expenses and what is left after them, and a branch's best sellers), Stock, Purchases, Khata (with advances), Expenses, Shifts, Staff and Alerts, as each store PC last sent them. The other reports are on the store PC only. See The owner portal.
Reports in Urdu
When Settings › Business › Printed documents is Urdu or English and Urdu, these tabs print and save as PDF in that language: Daily, Day by day, Best sellers, By tender, Profit and loss, Stock value and Ageing, and so do the Stock page, the Khata list, Expenses and a shift's Z report. In Urdu the page is laid out right to left: the title at the right, the first column at the right and the amounts at the left; names, bill numbers, dates and amounts still read left to right. Dates and amounts keep the reports' own format (26-09-2026, 1,234,567.00). A line under Excel, CSV, PDF and Print says Printed in Urdu — change in Settings › Business › Printed documents; on the tabs that print in English only (Brands, the stock tabs and the others) it says the printout stays in English. The app's own screens stay in English.
Excel and CSV ask when you save whether the headings should be in English, in Urdu or in both; they start on the language of your printed documents. Figures in the file stay plain, and the Stock and Best sellers files have an Urdu name column for items that have one, so a file can be read back with Importing from CSV.
Common questions
Why is gross profit different from sales minus purchases?
Profit counts the cost of the items sold, not of everything bought. Stock bought but not yet sold is in the stock value, not in costs.
Can I export a report to Excel?
Yes. Every tab has Excel, which saves a workbook with the report's heading, figures and tables, numbers as numbers and dates as dates. CSV works too: numbers are saved without thousands separators and dates as year-month-day, so Excel can add them up.
Does profit include the advances customers paid?
No. Advances are money owed to the customer until used on a bill. They count as sales only when the goods are billed. See Customer advances.
Is there a report per cashier?
Yes: By cashier lists every cashier's (or counter's) bills, sales, discounts and returns for the period, and prints or exports like any tab. On Sales, choosing a cashier and a period adds up that cashier's bills too. Each shift's Z report on Shifts shows its cashier, bills and drawer; see Shifts and closing the day.
Which report tells me what to order before Ramazan?
Low stock & reorder gives a suggested order from reorder levels and the last 30 days' sales. Ahead of a busy month, look at Best sellers for last month or the financial year so far, and raise the reorder levels of the items that sell most, so the suggestion grows before the rush.
Related guides
Last updated 05 October 2026. Still stuck? Contact us.